
The Boredom Trade
Weekly Intelligence Report, June 23, 2026


Before we start I would like to tell you something. There is a $200 USDT giveaway running exclusively for my subscribers at the moment! And it’s not for long.
This newsletter is now partnered with BingX. I’m not going to sugarcoat it: It’s easy money sitting on a table for you. You can thank me later.
Also, new features will come from this partnership to make your life easier and not miss the timing of the market. Stay tuned!
Now, what you came here for…
GM friends. I’ll be honest with you: the past few weeks have been the hardest kind of market. Not the crash-hard. The nothing-hard. The kind where you wake up, check price, see it hasn’t moved, and wonder if you’re wasting your time even paying attention.
That’s by design.
Markets don’t just liquidate overleveraged traders with crashes. They liquidate patient ones with boredom. Slowly. Day after day of nothing, until you either sell out of frustration, increase leverage out of impatience, or simply stop watching. And then it moves.
We’re sitting at $63,839 with a Cycle Z-Score deep in the VALUE zone at −1.14σ for 100 consecutive days now. Analyst consensus is bearish. And yet, every on-chain valuation model I look at says the same thing: you’re buying at a historical discount.
The market is designed to bore you out of position. The question is whether you recognize the setup before the move, not after.
I want to walk you through what I’m seeing this week, because the data underneath the noise is telling a very different story.
The Patience Tax
The Sharpe Ratio tells a story that most people gloss over.
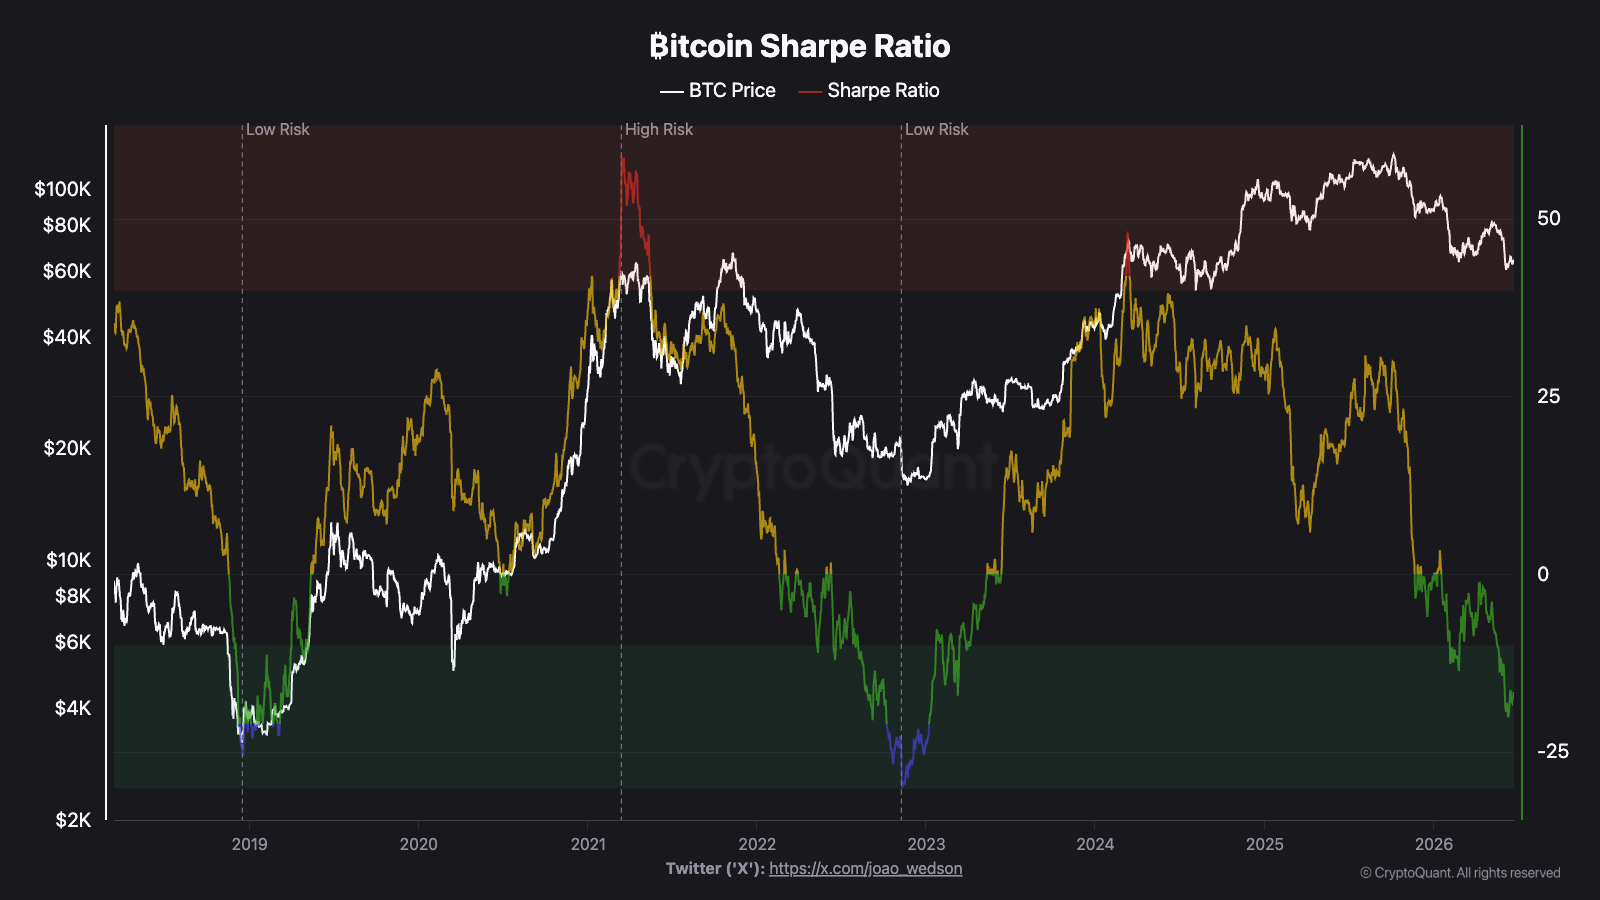
Right now, Bitcoin’s long-term Sharpe Ratio is sitting near zero, firmly inside what CryptoQuant labels the “Low Risk” zone. This is a zone that, historically, has marked some of the most asymmetric entry points of the past decade. Not guaranteed. Never guaranteed. But the risk-adjusted profile at these levels is as favorable as it gets.
What does “Low Risk” actually mean here? It means the market has already priced in most of the downside. The expected volatility relative to returns has compressed to a point where the next big move is statistically more likely to reward than punish. We’ve been in this zone during every major accumulation phase since 2015.
And most people can’t stand it. Because Low Risk doesn’t mean exciting. It means boring. It means weeks of choppy sideways action while your timeline fills with bearish takes and you wonder if the bottom is actually in.
Also, yes, we can go a bit lower from this point.
The MVRV Percentile confirms it from a completely different angle.
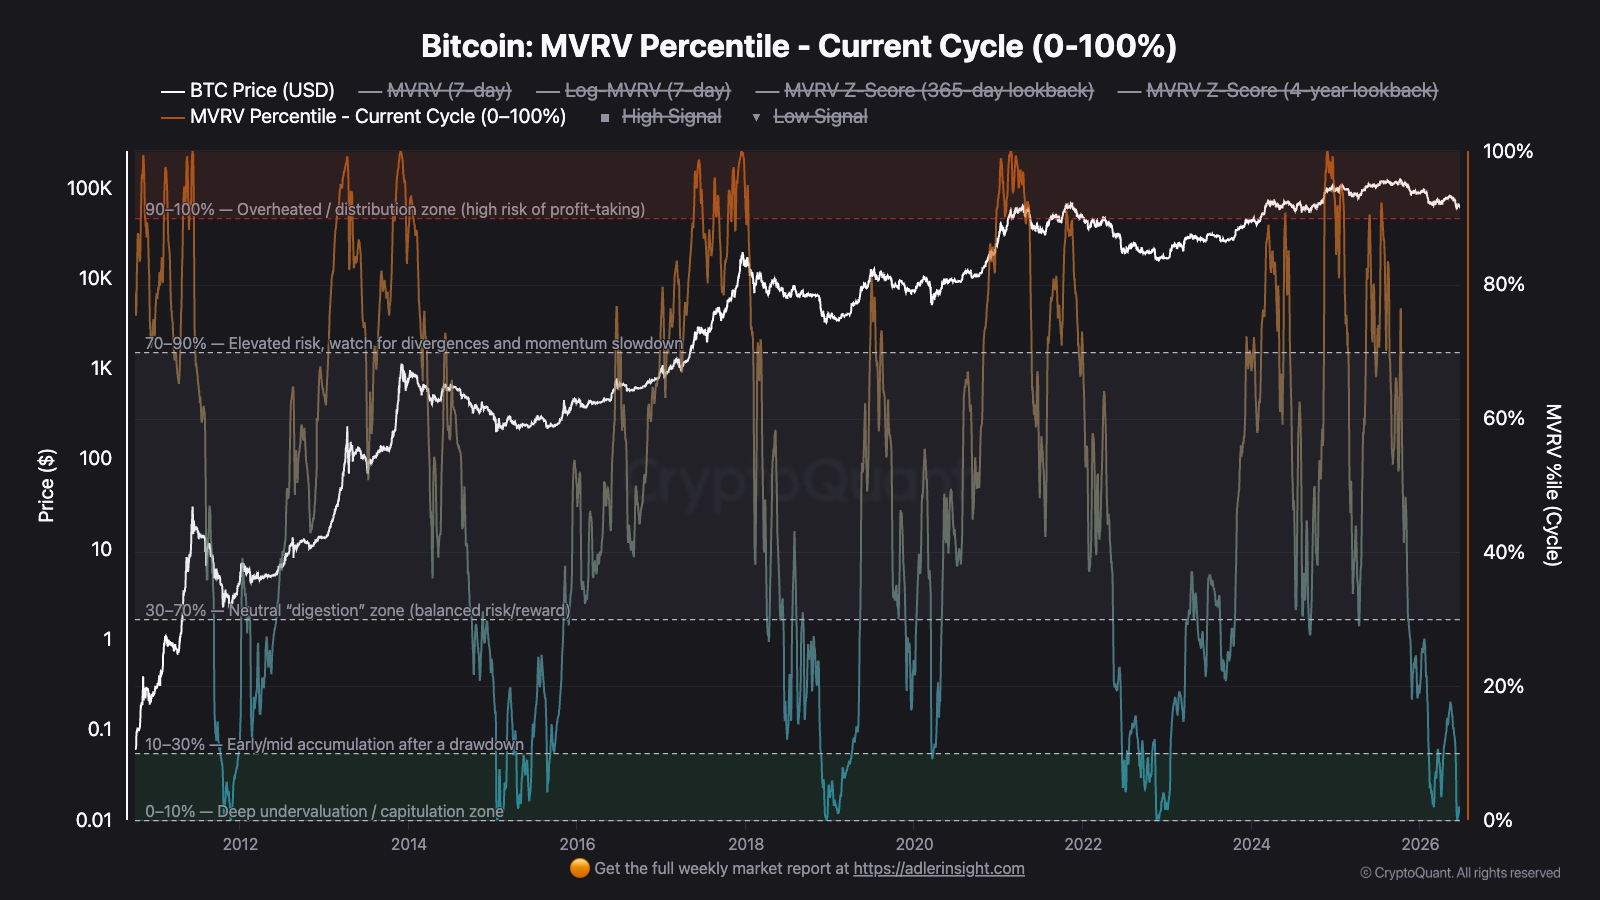
We’re currently sitting in the 0-10% percentile range. That’s the “deel undervaluation/capitulation” zone. Do you understand what that means, right?
Every day you hold in this zone feels like a cost. The portfolio isn’t recovering fast enough. Other assets are moving. The timeline is bearish. Your brain tells you to cut, rotate, do something. That’s the patience tax. And historically, every investor who paid it was compensated.
But here’s where it gets really interesting. The short-term holder picture tells us exactly who’s feeling the pain most.
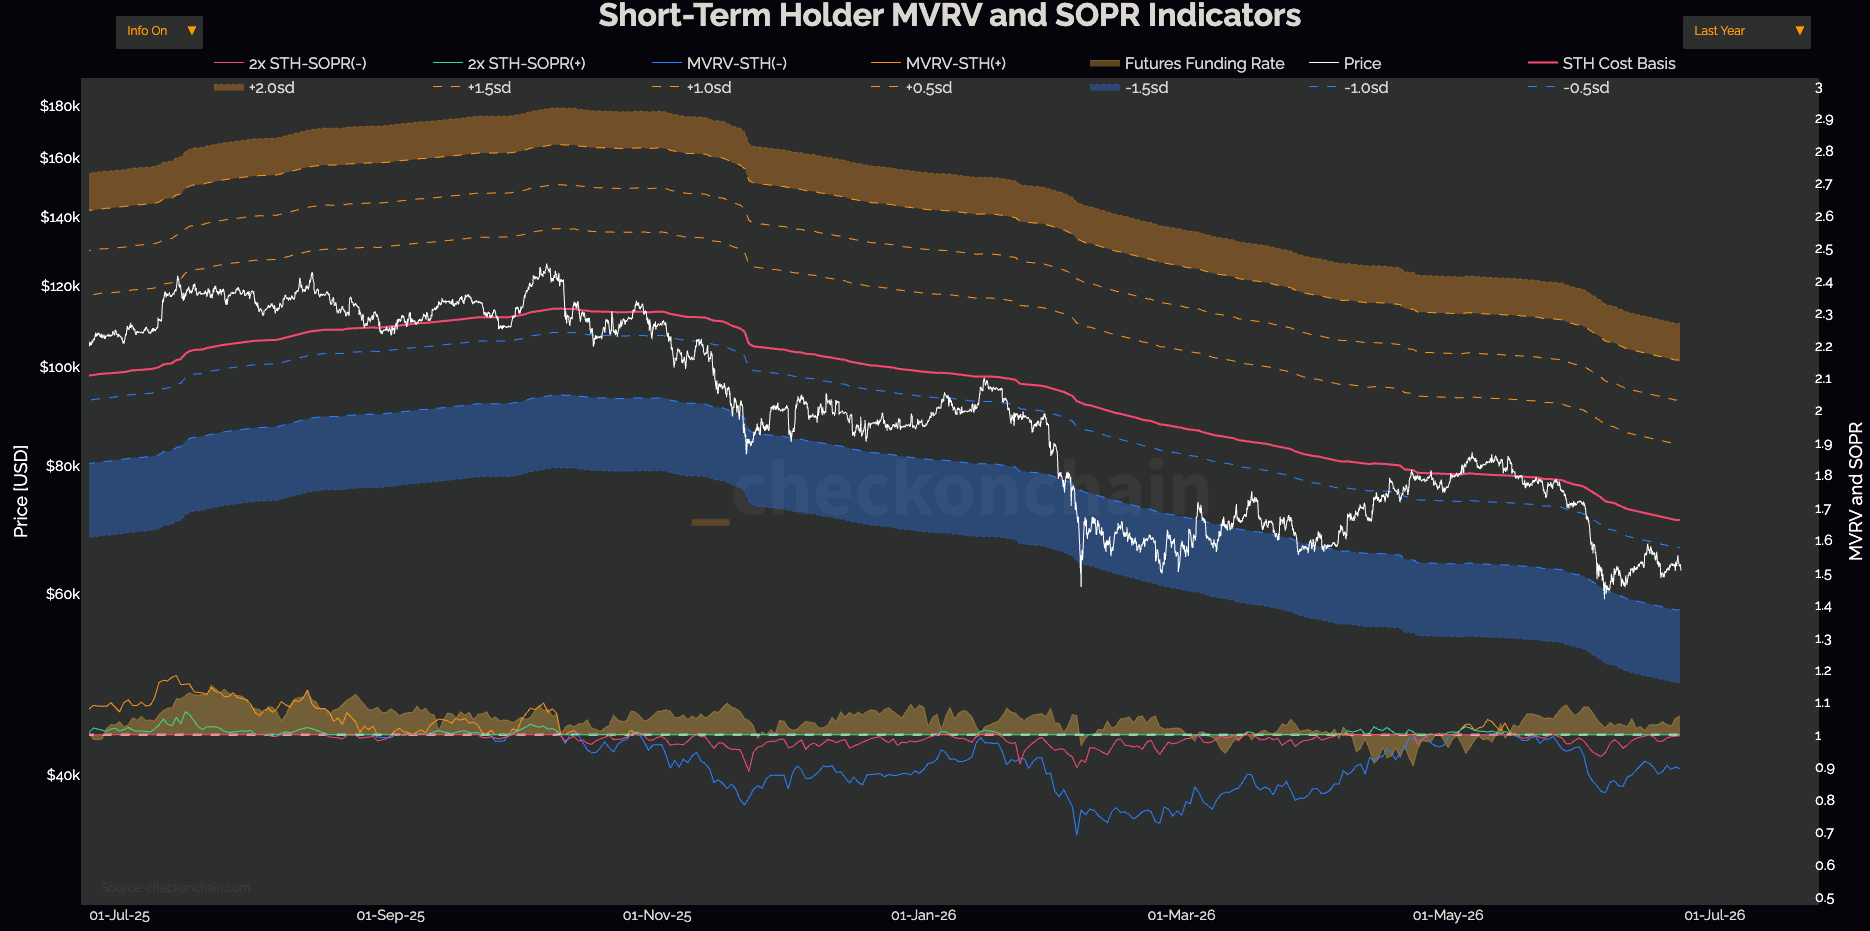
CheckOnChain’s STH MVRV and SOPR composite shows price trading below the STH Cost Basis, deep in the −0.5 to −1.0 standard deviation band. SOPR is hovering around 1.0, meaning short-term holders are selling at breakeven or at a loss. The people who bought in the last 155 days are underwater. They’re the ones being shaken out. They’re paying the boredom tax in real losses, not just opportunity cost.
This is exactly what accumulation looks like from the inside. Not a V-shaped bounce. Not a dramatic capitulation. Just slow, grinding pressure on weak hands until they give up.
The rest of this report is for paid subscribers: proprietary valuation models, the full on-chain deep dive, risk levels, and my personal positioning with skin in the game. If this analysis helps you think more clearly about your own decisions, subscribe here to get the full picture every week.
