
When the Long-Term Holders Turned Red
Weekly Intelligence Report, June 30, 2026

GM friends.
I’ll be honest with you about how I’m spending my time lately, because it shapes how I’m reading this market. I’m not staring at price all day anymore. Most of my hours right now are going into building a terminal, and it’s becoming something genuinely incredible, a tool I can’t wait to put in your hands. On-chain has shifted into the background for me, not because it stopped mattering, but because I’ve stopped using it to guess the next candle. I check it now the way you check the weather before a long trip. Context. I’m looking for the one structural thing that tells me the medium-term picture is finally turning, and this week the cohort map gave me something worth stopping for.
The long-term holders are now underwater. Not the tourists, not the leverage crowd. The 1-to-2-year cohort, the people who bought a year ago and held through everything, are sitting on coins worth less than they paid. Their average cost basis is $89K. Price is $60K. That’s a 34% loss on the steadiest hands in the market.
When that happens, there’s usually one of two stories underneath it. Either these holders start to break and sell into the pain, which is how capitulations feed themselves and how floors get violent. Or they don’t sell at all, they do the opposite, and the loss becomes a test of conviction rather than the start of a cascade. Those two paths look identical on a price chart for a while. They are completely different underneath.
I want to show you which one the data is actually pointing at. Because the answer is the kind of medium-term signal I’ve been watching for, and it changes how I’m reading this entire correction.

This newsletter is partnered with BingX, where I execute most of my trades.
Last two days in my 200 USDT campaing.
bingx.com/partner/rugaresearch — Access via the link and get that to buy some BTC right now!

The Holders Who Refused to Sell
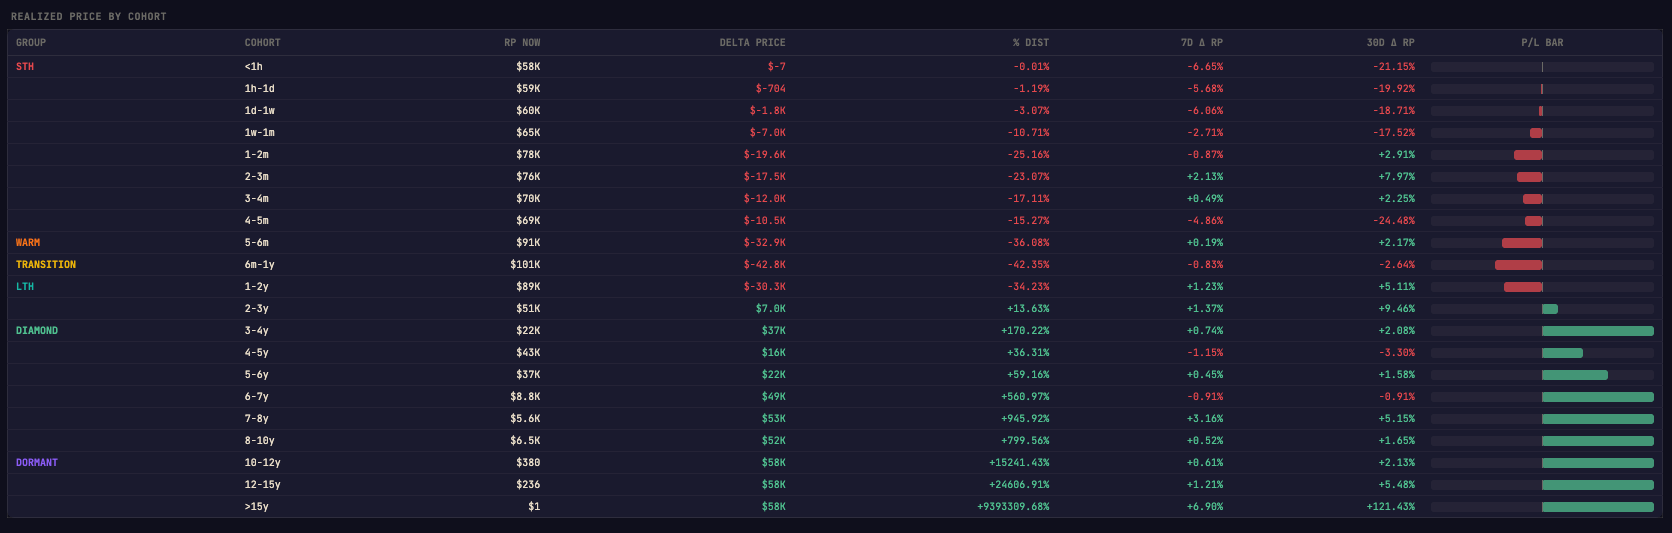
Start with the map itself, because it sets the stage for everything.
Short-term holders are deep in the red, and that’s normal in a drawdown. The 1-week-to-1-month cohort holds a $65K cost basis, down 11%. The 1-2 month group bought at $78K and sits 25% underwater. That’s textbook weak-hand pain, the kind that resolves itself when the sellers finally exhaust. But the part that actually matters is higher up the curve, in the cohorts that aren’t supposed to bend. The 6month-to-1-year transition group averages $101K, down 42%. And the long-term holders themselves, the 1-2 year band, are red now too, $89K cost basis against a $60K price.
That’s the line I keep coming back to. When the 1-2 year long-term holders go underwater, the only cohorts still holding green are the truly ancient coins, and the next realized-price level beneath us is the 2-3 year group at $51K. So the question writes itself: are we walking down to find that $51K floor? Is this max-pain capitulation, or the setup for it?
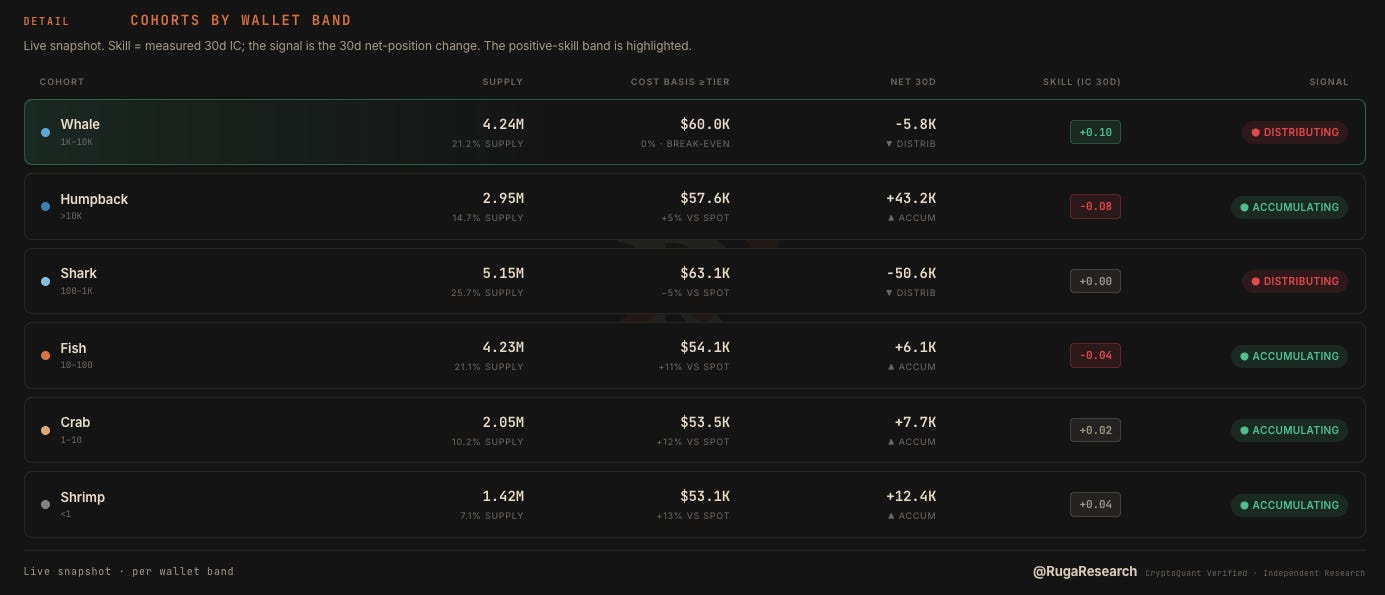
Here’s where it gets interesting, and here’s what I spent the week confirming. The long-term holders are in loss, but they are not selling. They’re accumulating. The Long-Term Holder Net Position Change over the last 30 days is +272,000 BTC, and it’s pure accumulation, with zero net distribution on the other side of the ledger. The steadiest hands in the market are underwater on price and still adding. That’s not what capitulation looks like. Capitulation is forced selling, coins moving at a loss because someone has to. This is the opposite. This is conviction buying into red.
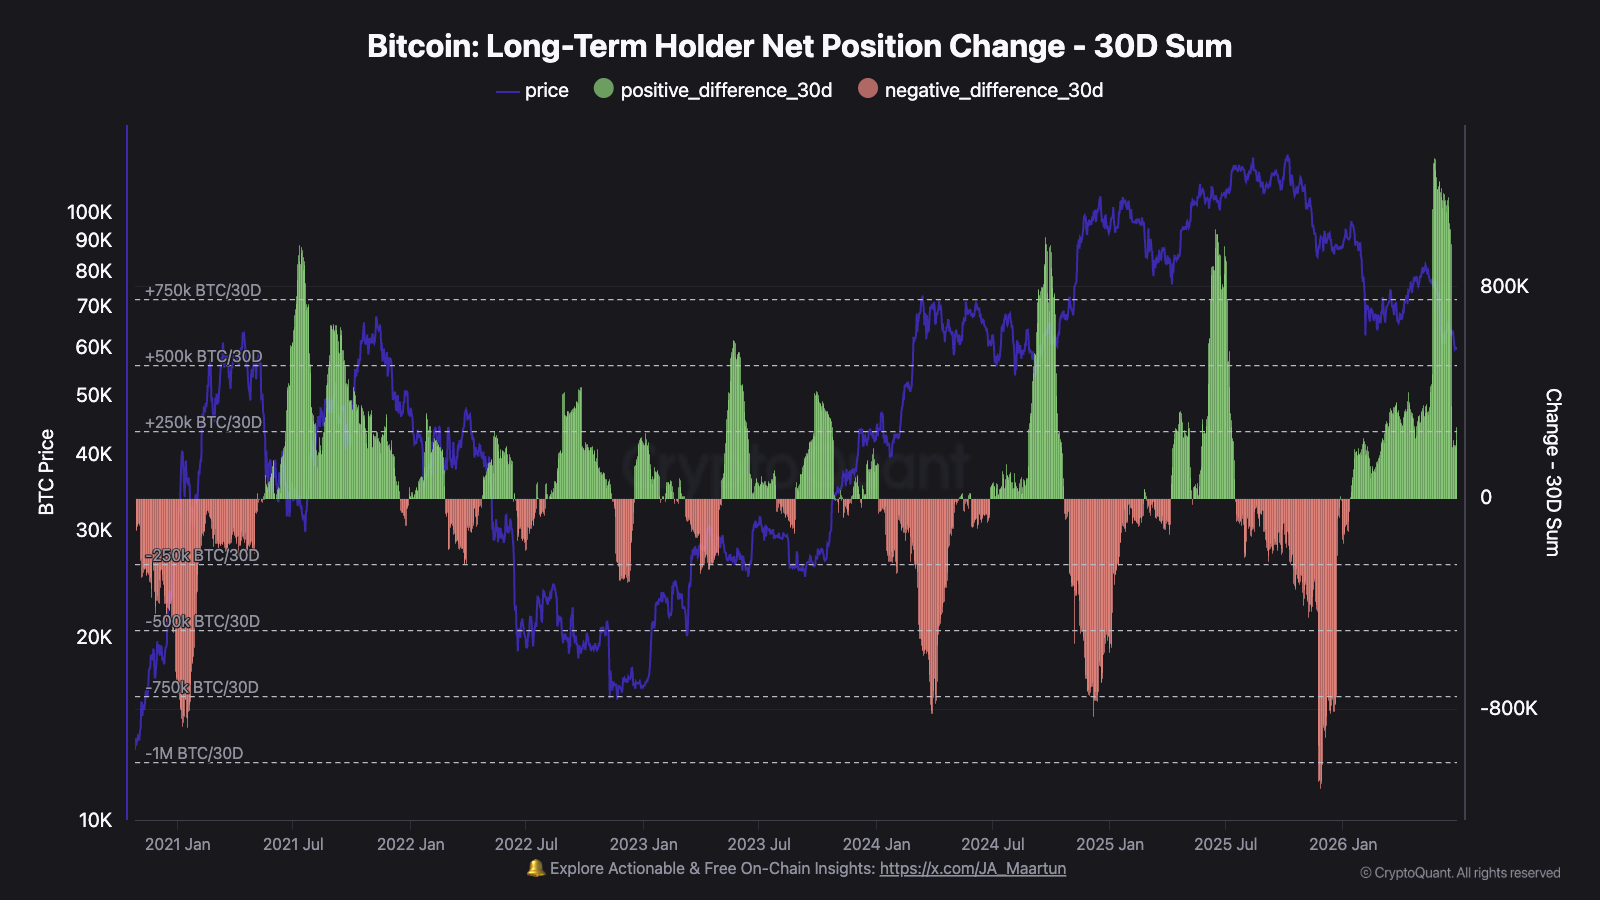
Long-term holders losing money on paper while still net-buying 272K BTC in a month. That’s not hope. That’s positioning.
But the interesting part isn’t just that they’re buying. It’s the pace.
The rest of this report is for paid subscribers: proprietary valuation models, the full on-chain deep dive, risk levels, and my personal positioning with skin in the game. If this analysis helps you think more clearly about your own decisions, subscribe here to get the full picture every week.
